Your facilities team manages 1,800 pieces of equipment across 12 buildings. The maintenance team you’re responsible for supports 240 machines across three plants. Eight thousand Chromebooks went out from the district IT department last fall, and someone needs to know which ones are still working in May. Somewhere in a shared drive there is a spreadsheet that tracks all of it, and somewhere in the spreadsheet there is a row that hasn’t been updated in fourteen months.
This is the part of operations nobody puts in the brochure. Tracking the physical world against a digital ledger is slow, error-prone work. Barcode scanners cost real money and only do one thing. RFID is fantastic at scale but the per-tag cost makes it a non-starter for anything you don’t want to pay $0.20 or more to label. Manual entry is what most teams quietly fall back to, which is also why most ledgers are wrong.
QR code inventory management is the workflow that has quietly replaced both ends of that spectrum at organizations that decided their ledger should match reality. When we built our bulk QR generation for warehouse customers last year, I expected the appeal to be the technology. What I heard back was simpler: every employee already carries a scanner in their pocket, and a 2-inch sticker costs almost nothing. The rest of the platform just has to keep up. This guide is what I’ve learned about how that workflow really runs, where the savings show up, and what to evaluate when you put it in front of a procurement committee.
Last updated: June 23, 2026
TL;DR
- QR codes and smartphones replace both the barcode/RFID hardware tax AND the per-user pricing of legacy asset management platforms, typically 60-90% cheaper at mid-market scale.
- Dynamic QR codes are the enabler: the physical tag stays put forever, while the server-side destination updates as your workflow evolves.
- Evaluate any QR code-based platform against five procurement pillars: cost predictability, scale headroom, reliability (SLA), security (SAML, audit logs, RBAC), and integration (API, webhooks).
- If your asset list is already drifting, start with a pilot of one team under 5,000 assets to find workflow friction early, then expand category by category.
Key Numbers
- $30B — enterprise asset management software market (Gartner)
- $0.10-$0.30 per RFID passive tag vs $0.02-$0.10 per QR code label — typical per-asset hardware cost
- $800-$4,000 per RFID reader portal — replaced by the smartphone every employee already carries
- 60-90% typical cost reduction vs per-user/per-asset legacy platforms at mid-market scale
- 99.9% — QR Chameleon’s published monthly uptime SLA, measured by independent third-party monitoring (qrchameleon.com/sla)
Why Operations Teams Are Moving from Barcodes and RFID to QR Codes
Asset and inventory management is a $30 billion software category according to recent Gartner research on enterprise asset management. The technology underneath has cycled through three eras: paper logs, then barcode scanners and proprietary handheld terminals, then RFID for high-value cases. QR codes are the fourth wave, and they’re winning for reasons that have less to do with the code and more to do with what’s already in the room.
What a QR Code Adds Over a 1D Barcode
A QR code does everything a 1D barcode does and more. It can hold roughly 4,000 characters versus the 20-25 a UPC carries. It survives partial damage thanks to built-in error correction, so a coffee ring or a forklift scrape on a warehouse label doesn’t kill the read. And because the encoded data is a URL, not a SKU string, every scan can route to live, server-side context: the latest service date, the current work order, the chain-of-custody record. That separation is the most important thing on this page. The QR pattern on the label never changes, but the destination it points to can be updated server-side at any time without reprinting anything.
Static vs Dynamic Codes for Inventory
That’s the difference between static and dynamic QR codes. Static codes encode the destination directly, which means changing what they point to requires regenerating and reprinting every label. Dynamic codes encode a short link and route through a server-side redirect, which means the asset tag stays the same forever and the destination updates whenever the workflow needs it to. For inventory work, only dynamic codes make sense. The tradeoffs are covered in detail in our static vs dynamic QR codes guide if you want the full comparison.
When Barcodes and RFID Still Make Sense
Barcode systems still ship, but they require dedicated scanners, dedicated software, and an IT team to keep the handhelds patched. RFID delivers no-line-of-sight reads and remains the right choice for high-velocity logistics where you’re reading hundreds of pallets a minute, but the per-tag cost (typically $0.10-$0.30 for passive tags, $5+ for active) and reader infrastructure ($800-$4,000 per portal) keep it out of reach for most mid-market deployments. According to IDTechEx market reporting, RFID hardware costs have come down significantly, but the gap between “scan with the phone every employee already owns” and “stand up a reader infrastructure” is still the determining factor for most operations leaders making the call.
A QR code also wins on the audit side. When the scan goes through a redirect, every read creates a server-side log entry with timestamp, location (via IP geolocation), user, and device. That ledger answers questions barcode and RFID systems often can’t: who scanned the asset, when, and from where.
How QR Code Inventory Management Works in Practice
The mechanics are simpler than vendors often make them sound. The workflow runs in four steps, and once it’s set up the day-to-day overhead is minimal.
Generate Codes in Bulk
First, you generate a unique QR code for each asset. For 50 items you can do this one by one in any QR platform. For 5,000 items you need bulk generation: upload a CSV with one row per asset, get back a downloadable archive of PNGs or SVGs with one QR code per asset, each pointing to its own unique short link. Most operations teams I’ve talked to underestimate how often they need to do this in batches of hundreds or thousands. Bulk CSV generation isn’t a nice-to-have; it’s the feature that determines whether the platform will hold up at scale.
Print and Apply the Labels
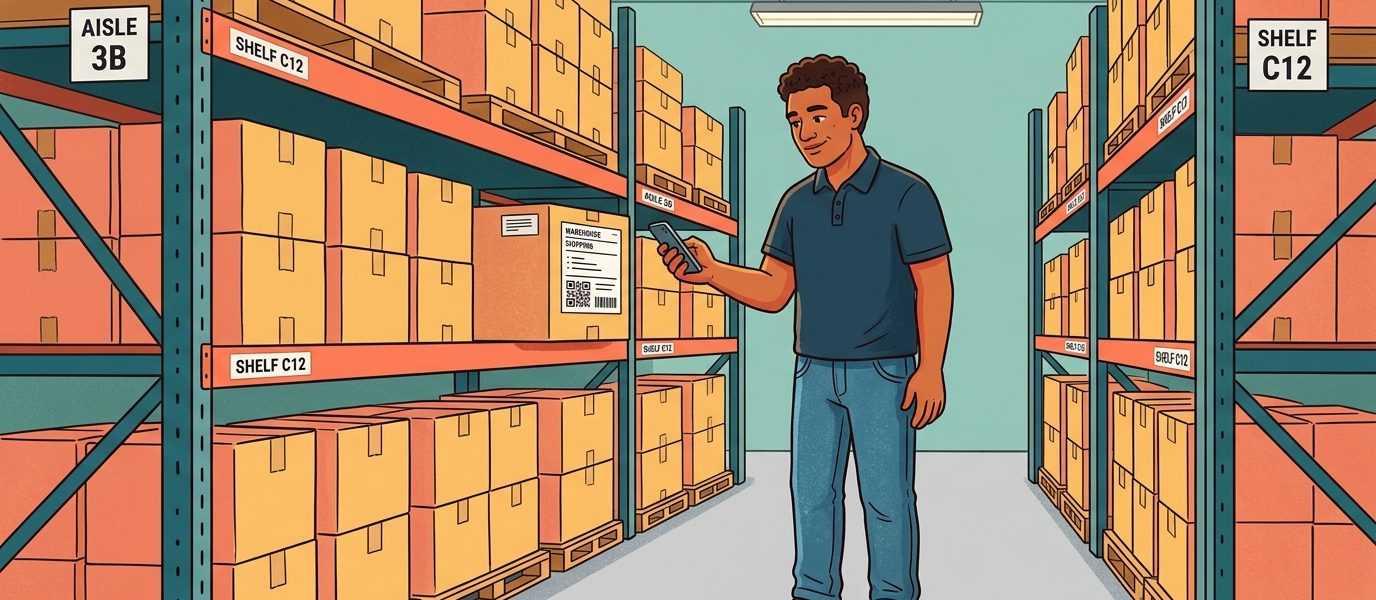
Second, you print and apply the labels. The material matters: paper labels work for office and classroom use cases, polyester laminate handles warehouse and outdoor conditions, anodized aluminum survives industrial environments. The format depends on the use case. For individual asset tags on equipment, a 1- to 2-inch QR scans reliably from arm’s length. For pallet and shipment tracking, the QR is integrated into a larger printed shipping label alongside the SKU, quantity, destination, ship date, and a 1D barcode, sized to be read from across a warehouse aisle. Full substrate and adhesive specifications, including ordering strategies at different volumes, are covered in our QR code asset tags guide.
Scan in the Course of Normal Work
Third, your team scans the assets in the course of normal work. The scan opens a destination page that is whatever your workflow needs it to be: a service history page, a checkout form, a maintenance ticket form, an embedded video of the standard operating procedure. Because the destination is a URL, you can change it for every asset, every category, every department, or even by time of day. The same physical sticker can route to one form during business hours and a different one after hours, or to one page for the IT team and a different page for facilities.
Feed Scans Back into the Dashboard
Fourth, the scans feed back into your inventory dashboard automatically. Every scan event is recorded with the asset ID, scan time, scanner device type, and geographic information. Over time the pattern of scans tells you which assets are used and which are sitting unused, which categories are getting flagged for maintenance fastest, which locations are running hot. The analytics layer is where a QR inventory system starts paying for itself.
Generate Inventory QR Codes in Bulk
Upload a CSV of your assets and get back unique dynamic QR codes for each,
with full scan analytics built in.
What QR Inventory Management Looks Like Across Industries
The use cases are different from one vertical to the next, but the underlying pattern is the same: a sticker on the asset, a phone in the technician’s pocket, a server-side workflow that updates without anyone reprinting anything.
Manufacturing
A maintenance technician walks up to a CNC machine that just threw a fault code. She scans the 2-inch aluminum QR plate riveted to the side of the cabinet. The destination loads her last three service tickets for that exact machine, the current preventive maintenance schedule, and a button to open a new work order with the asset ID pre-filled. Five minutes are saved on every fault response. Multiplied across 240 machines and a dozen technicians, that’s a measurable line item. The full maintenance, calibration, and compliance workflow specific to equipment tracking is covered in our QR code equipment tracking guide.
Healthcare
A nurse on the night shift needs to confirm that the IV pump in room 304 is current on its calibration. She scans the small QR sticker on the bottom housing. The destination shows the last calibration date, the technician who signed off, the next due date, and a flag if the unit is approaching the recall window. According to the ECRI Institute annual hazards reports, medical device tracking errors are a persistent source of patient safety incidents. A scannable, server-side ledger collapses that risk significantly.
Education Districts
A district IT lead is auditing the Chromebook fleet at the end of the school year. He works through a cart of returned units, scanning each device’s asset tag. Each scan records the device, the timestamp, the user (his own login), and updates the device record to “returned, end of year.” What used to be a multi-day project with a clipboard and a spreadsheet finishes in an afternoon. The data is also queryable for the next year’s procurement decision: which models had the most service tickets, which buildings had the highest loss rate.
Retail and Multi-Location Operations
A regional store manager visits a location and scans the QR code on a display end cap. The destination loads the current planogram, the merchandising guidelines for that fixture, and a video walkthrough of the rotation. The same QR code shows different content depending on the date because the dynamic destination updates with the campaign calendar. Stores never have outdated planograms because the QR codes were never reprinted; only the server-side destination changed.
Government and Public Sector
A municipal fleet manager scans the QR plate on the dashboard of a public works truck. The destination shows the last oil change mileage, the upcoming inspection date, and the open recall status from the manufacturer. For state and federal asset reporting, the audit trail of every scan is admissible documentation. The cost is functionally zero per asset.
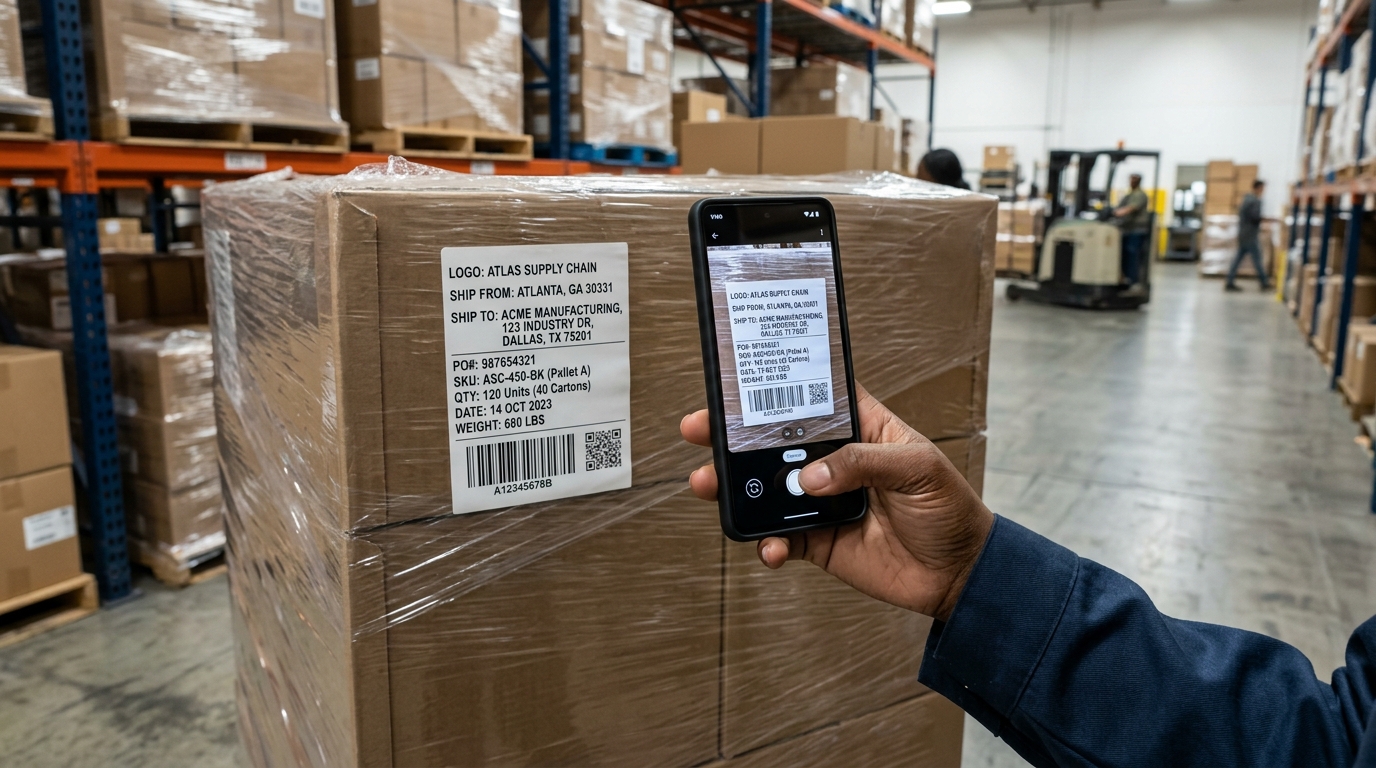
Logistics and Warehousing
A picker walks down a warehouse aisle and aims her phone camera at the printed shipping label on the side of a shrink-wrapped pallet. The label already shows the SKU, quantity, ship-from and ship-to addresses; the integrated QR code routes her to the live chain of custody record: where the pallet originated, its current bin assignment, the next destination, and a confirmation form. The label itself was printed on demand for pennies. The phone was already in her pocket. The system that used to require a dedicated barcode scanner and proprietary WMS handheld terminals now runs through the device every warehouse employee already owns.
Hospitality
A housekeeping supervisor scans the QR on the side of a service cart at the start of a shift. The destination loads the restock list for that cart, the rooms assigned to that floor for the day, and a checklist for end-of-shift verification. The same sticker stays on the cart for years; only the daily routing changes.
How QR Codes Compare to Barcodes, RFID, and Legacy Asset Management Platforms
The right comparison isn’t QR code versus paper; it’s QR code versus the systems most operations teams are already paying for.
How we compared: Nine evaluation dimensions covering hardware capital, ongoing SaaS cost, read characteristics, audit support, bulk-operation scale, integration headroom, and analytics availability. Cost ranges synthesized from public pricing pages and procurement quotes published by Asset Panda, Sortly, EZOfficeInventory, GoCodes, Cheqroom, and equivalent peers; QR / barcode / RFID hardware costs cross-referenced against IDTechEx market reports and major vendor (Zebra, Honeywell, SATO) published list pricing.
| Capability | Manual / Spreadsheet | Barcode (1D) | RFID | Legacy Asset Mgmt Platforms | QR Code Inventory Management |
|---|---|---|---|---|---|
| Per-asset hardware cost | $0 | $0.02-0.05 label + scanner | $0.10-$5+ per tag + reader | Depends on tier | $0.02-0.10 per label |
| Reader / scanner hardware | None | $200-$2,000 per device | $800-$4,000 per portal | Often required | Existing smartphones |
| Read without line of sight | N/A | No | Yes | Varies | No |
| Update destination without reprinting | N/A | No | Yes (with active tags) | Yes | Yes (dynamic codes) |
| Audit log per scan | Manual | Limited | Yes | Yes | Yes, automatic |
| Per-user / per-asset SaaS cost | $0 | Often per-user license | High | $35-$200+/user/mo | Flat platform price |
| Bulk generation 1,000+ assets | Manual | Yes (with software) | Yes | Yes | Yes via CSV |
| API for system integration | None | Varies | Varies | Yes (tier-gated) | Yes on every tier |
| Real-time scan analytics | None | Limited | Yes | Yes | Yes, on every plan |
The legacy asset management platforms in this space (Asset Panda, Sortly, EZOfficeInventory, GoCodes, Cheqroom and similar) price per user, per asset, or both. For a team of 10 with 5,000 assets, the math typically lands in the $200-$800/month range before any add-ons. They also tend to gate the analytics and API behind higher tiers. A QR-first platform priced as a flat link-and-QR management subscription removes most of that variable cost. The question worth asking your finance team is what the total cost of ownership looks like at your current asset count and your projected 3-year asset count, not what the introductory tier costs.
Where QR Code Inventory Management Saves Real Money
Operations leaders evaluating any new system want to know the real number, not the marketing number. Here are the line items where the savings show up.
Lookup Time per Scan
A spreadsheet lookup for an asset record runs 90 seconds to 3 minutes depending on how organized your sheet is and how new the technician is. A QR scan resolves in about 1.5 seconds and lands the technician on the relevant record. At 1,000 scans per month and a $35 fully-loaded labor rate, the recovered time is roughly $700-$2,000 per month before any other benefit. For an organization with 5-10 field technicians scanning 200-500 times each per month, this alone justifies the deployment.
Reprint Avoidance
This is the dynamic QR advantage and it’s often the biggest line item in environments where assets get repurposed or destinations change. Every time a department reorganization or vendor change would have required a relabel cycle, the QR codes stay put and the destinations update server-side. For deployments at scale (10,000+ tagged assets), one avoided relabel cycle can offset the cost of the platform for years.
Audit and Compliance Documentation
For regulated industries, the per-scan log answers the auditor’s questions before they’re asked. This covers medical device tracking, government fleet maintenance documentation, school district asset records, and food traceability under GS1 Digital Link standards. The server-side scan log replaces a binder of paper forms that someone used to be paid to file. Indirect savings here are harder to quantify, but the avoided-incident value can be substantial.
Reduced Loss and Ghost Inventory
Spreadsheets gradually disconnect from physical reality. QR scans create a passive feedback loop: every scan confirms the asset exists, where it is, and who interacted with it last. Ghost inventory (records for assets that no longer exist) shrinks the longer the system runs. For organizations that had been over-ordering replacements because they couldn’t find the originals, the inventory savings are direct.
Training Time
A new technician’s first day used to involve memorizing the spreadsheet, the asset numbering scheme, and the lookup process. With QR-driven workflows, the first task is “scan the asset and follow the prompts.” Onboarding ramp time for new ops hires drops measurably.
A Practical Implementation Walkthrough
If you’re sizing this up for a deployment, here’s how the work unfolds in week one.
Pick One Category to Start
Pick the asset category you’ll start with. Don’t try to tag everything at once; pick the single category where the spreadsheet pain is worst right now. For most teams that’s either field equipment, IT devices, or school district inventory like AV equipment, tablets, and classroom hardware. The full asset tracking lifecycle workflow, from acquisition through retirement, is covered in our QR code asset tracking guide.
Design the Destination Page
Build the destination workflow before you generate the codes. The QR code is the easy part. The hard part is deciding what scanning an asset should load. Sketch the destination page for a single category: what information should appear, what actions should be possible. Then build that page once, on whatever your team already uses (a Google Site, a Notion page, a simple form, an internal app). The destination just needs to be a URL.
Export your asset list to a CSV. One row per asset, with the asset ID, the destination URL (which can be the same template per category with a query parameter for the asset ID), the asset name, and any internal categorization you want preserved.
Generate and Print at Scale
Bulk generate. The CSV goes into the QR platform; the output comes back as a downloadable archive with one QR code per row plus the underlying short link. On QR Chameleon’s Adapt plan, bulk uploads handle up to 100 assets per upload; Transform handles up to 3,000 per upload, and Enterprise custom arrangements remove the cap entirely. When I tested a 1,000-asset bulk run with one of our early warehouse customers last spring, the generation finished in 38 seconds end-to-end, including the SVG render of each individual code. The output worked cleanly with the customer’s label-printing software.
Print and apply. Use the material and format appropriate for the environment. For individual asset tags, polyester laminate at 2 inches is usually the right call. For pallet shipping labels, design the QR into your existing label template alongside the SKU, quantity, destination, and barcode, and print on demand from a thermal label printer.
Roll Out and Iterate
Roll out to one team. Get the first scans on the books. The point is to find the workflow friction early when you have 50 assets in the system, not when you have 5,000.
Iterate the destination. The first version of your scan destination will be wrong in small ways. Some fields will be missing. Some actions will be in the wrong order. Update the destination server-side; no labels get reprinted. This is the entire reason dynamic codes exist.
Roll out to the next team. Repeat. The pattern is repeatable across categories once the first one is solid.
For teams handling integrations into existing maintenance, ERP, or IT asset systems, the QR Chameleon API handles the programmatic generation and the webhook events on scan, which lets you wire scan-triggered actions into your existing ticketing and notification systems.
Comparing QR Inventory Platforms
Beyond the question of QR versus barcode or RFID, the second comparison most teams run is which QR platform to build the deployment on. The points worth checking are the ones procurement always asks about: cost predictability, scale headroom, security, and integration.
Cost Predictability
Per-asset or per-scan pricing models scale unpredictably as your tagged asset count and scan volume grow. A flat platform subscription with high-ceiling limits on every relevant resource (links, QR codes, scans, API calls) is much easier to forecast.
Scale Headroom
The deployment that started with 500 assets in IT often grows to 50,000 assets across operations within 18 months. The platform should not become the bottleneck. QR Chameleon’s Transform plan supports 3,000 QR codes per month and 3,000 per bulk upload, plus 250,000 API calls per month and 1,200 per minute in burst rate. Enterprise custom arrangements remove the monthly link, QR code, and API caps entirely for organizations operating at industrial scale.
Reliability
The moment a QR-driven workflow goes down, the warehouse floor or the maintenance bay stops with it. QR Chameleon publishes a 99.9% monthly uptime SLA for Transform and Enterprise customers, with service credits at the 5%, 10%, and 25% brackets if we miss it. Uptime is measured by independent third-party monitoring at five-minute intervals against four public endpoints, and the public status page routes to that third-party host so the numbers cannot be massaged on our end. For procurement teams putting QR-based asset tracking through an RFP, that level of transparency is uncommon in the link and QR management category.
Security
Procurement and IT teams gate-keep on security. QR Chameleon ships bot detection and VPN, proxy, and Tor detection on every plan; SAML SSO through Okta, Entra ID, Google Workspace, OneLogin, PingFederate, JumpCloud, Auth0, and any custom SAML 2.0 identity provider on Transform; full audit log retention (30 days on Adapt, 1 year on Transform, 2 years on Enterprise custom); and Admin, Editor, and Viewer roles for team workspaces. Custom branded domains are available on Adapt and above, so the scan URL on the asset tag can be your organization’s domain instead of a third-party shortener.
Integration
Your operations data shouldn’t live in a separate silo. The REST API is available on every plan including Free, with 1,250 requests per month on the free tier as a meaningful prototyping allowance. Webhooks on Transform notify your downstream systems on every scan event. Detailed scan analytics with device intelligence, geographic data, and bot filtering are available on every tier, with the data history window scaling from 7 days on Free to 1 year on Transform and beyond with Enterprise.
For teams running their own labeling, ERP, or WMS stack, the QR Chameleon API returns codes as SVG that drop directly into existing label-design templates in BarTender, NiceLabel, Loftware, ZebraDesigner, and similar enterprise tools. The Zebra, SATO, or Honeywell printer then composes the QR into the same label as the SKU, quantity, ship-to address, and 1D barcode fields; the customer’s WMS or ERP subscribes to scan webhooks for automatic stock-on-hand and chain-of-custody updates. We cover the integration patterns end-to-end in our QR code label printing API guide.
Reference framework: The 5 Procurement Pillars for QR Inventory Platforms (cost predictability, scale headroom, reliability, security, integration) — © QR Chameleon, 2026. Cite as: “5 Procurement Pillars” (QR Chameleon).
The QR code statistics for 2026 make the broader case for why scan-driven operations are the direction the category is moving. For teams comparing against the incumbents (Bitly, Rebrandly, and similar), the Bitly comparison covers the link management side of the same question.

Pilot free. Deploy at scale.
Free tier handles your proof of concept. Transform handles the rollout.
See Plans and PricingFrequently Asked Questions
How does QR code inventory management work?
You generate a unique dynamic QR code for each asset, apply it as a label, and your team scans the code with a smartphone during normal work. Each scan loads a destination page that you control (service history, maintenance form, checkout flow), and the scan is automatically logged with timestamp, location, device, and user. Because the codes are dynamic, the destinations can be updated server-side without ever reprinting the labels.
Is QR code inventory tracking better than barcodes?
For most mid-market operations deployments, yes. QR codes hold more data, survive partial damage thanks to built-in error correction, and use the smartphone every employee already owns instead of requiring dedicated handheld scanners. Barcode systems still work in environments with high-velocity dedicated-scanner workflows, but QR has become the default for new deployments because the hardware cost is effectively zero.
How much does QR code inventory management cost?
The total cost includes the platform subscription (typically $10-$200 per month depending on team size and asset count), label printing (around $0.02-0.10 per polyester laminate label), and the time to roll out. There is no per-scan or per-asset license cost on flat-rate platforms. Compared to legacy asset management software that charges per user or per asset, QR-based inventory management is often 60-90% cheaper at mid-market scale.
Can I generate QR codes for inventory in bulk?
Yes. Bulk generation via CSV upload is the standard workflow for inventory deployments. Upload a CSV with one row per asset, get back a downloadable archive of QR code files with one unique code per asset, each pointing to its own destination URL. QR Chameleon supports up to 100 assets per upload on Adapt, 3,000 per upload on Transform, and custom volumes on Enterprise arrangements.
Do QR code asset tags work in warehouses?
Yes, with the right label material. Paper labels are unreliable in warehouse conditions; polyester laminate and anodized aluminum are the durable options. A 2-inch QR code reads reliably from about 24 inches, which works for handheld scanning. For overhead inventory locations and forklift scanning, a 4-inch code stretches the read distance to about 60 inches.
How do I track which asset was scanned and when?
Every dynamic QR code scan is logged automatically with the asset ID, the scan timestamp, the device type, the approximate geographic location (via IP-based geolocation), and the referrer if applicable. The full scan history is queryable through the analytics dashboard or exportable via CSV and the API for integration with your downstream systems.
What’s the difference between dynamic and static QR codes for inventory?
Static QR codes encode the destination URL directly in the QR pattern. Changing the destination requires regenerating and reprinting every label. Dynamic QR codes encode a short link that routes through a server-side redirect, which means the destination can be updated at any time without reprinting. For inventory work, where destinations frequently need to change as workflows evolve, only dynamic codes make sense.
For operations, IT, and procurement teams evaluating QR code inventory management at scale, the building blocks ship on every plan: bulk CSV generation, full scan analytics, REST API access, and dynamic QR codes that update server-side without reprinting a label. Transform adds SAML SSO, a published 99.9% uptime SLA, one-year audit log retention, and 3,000-asset bulk uploads. Enterprise custom arrangements remove the caps entirely.
Start free at QR Chameleon, or contact our sales team for a custom solution.